Digital Signage Market by Type (Hardware (Displays, Media players, Projectors), Software, Services (Installation & Maintenance)), Application (Commercial, Infrastructural, Institutional, Industrial) & Geography - Global forecast to 2020
By: marketsandmarkets.com
Publishing Date: May 2015
Report Code: SE 2270


Please click here to get the relevant report of Video Wall Market by Product (Video Wall Displays, Housing, Installation, & Content Management), Application (Indoor, Outdoor, Menu Board, & Billboard), Vertical (Retail, Hospitality, Transportation, Healthcare) & Geography - Forecast to 2020
Digital signage, available in various sizes, is used in different applications for the purpose of advertisement. Advertisement is one of the major reasons behind the increasing demand for the digital signage in the market. Earlier, traditional methods of advertising such as print media were used but due to their drawbacks such as high cost, wastage of time, and difficulty in making of changes as per demand, they were replaced by digital signage, which overcame all these issues. The major reason behind the growth of the digital signage market was the increasing use of new display technologies such as OLED, which is increasingly used in small and medium-sized devices. This helped the market to cover several applications such as retail, healthcare, hospitality, transportation, and entertainment. With regard to this, the market for the commercial application would find potential opportunities such as targeting the product-specific customer, understanding the preferences of the customer, and ease of selecting products. The penetration level of digital signage in healthcare and hospitality segments is expected to witness a rapid growth. There are several factors that can be attributed to this growth such as enhanced customer experience, cost-effective promotion, and real-time display of emergency messages.
Despite the numerous advantages offered by digital signage, the lack of awareness regarding its benefits and the lack of standards for interoperability between devices are some of the important factors restraining the growth of the digital signage market. The increasing investment by companies for development of digital signage, acceptance from government sector for incorporating digital signage in public offices, increase in demand for commercial displays, prevention of paper wastage, and energy saving by the use efficient displays are the factors driving the market for digital signage.
The global digital signage market is expected to grow at a CAGR of 8.18% between 2015 and 2020, from $14.63 Billion in 2014 to $23.76 Billion in 2020. This report on global market analyzes the digital signage value chain, giving a clear insight into all the major and supporting segments of the industry. The market has been segmented on the basis of type, application, and major geographies (North America, Europe, APAC, and RoW). This report also evaluates market trends and technologies and market dynamics such as drivers, restraints, and opportunities along with the industrys challenges.
The global market report profiles some of the key technological developments in the recent times. It also profiles some of the leading players in these markets and analyzes their key strategies. The competitive landscape section of the report provides a clear insight into the market share analysis of key industry players.
The major players in global digital signage market are NEC Display Solutions (Japan), Samsung Electronics Co. Ltd. (South Korea), LG Display Co., Ltd. (South Korea), Sharp Corporation (Japan), Sony Corporation (Japan), Panasonic Corporation (Japan), AU Optronics Corp. (Taiwan.), Planar Systems, Inc. (U.S.), Adflow Networks (Canada), and Omnivex Corporation (Canada).
Market, by type:
The global digital signage market segmented on the basis of type includes hardware, software, and services.
Market, by application:
The global digital signage market segmented on the basis of application includes commercial (retail, corporate, healthcare, hospitality, and government), infrastructural (transportation & entertainment), institutional (banking & education), industrial, and others.
Market, by geography:
The report discusses the global digital signage market in four major geographical regions, namely, North America, Europe, Asia-Pacific, and rest of the world (RoW). The geographical analysis in the report further divides North America into the U.S., Canada, and others; Europe into the U.K., Germany, France, and others; APAC into China, Japan, Korea, and others; and the RoW region in to the Middle East& Africa and others.
Key Take Aways:
In this report, the global digital signage market is segmented into the following categories and the industry trends are also covered according to the following aspects:
- Total Markets: global digital signage market type market, sub-markets, related markets, complementary markets (with sub-segmentation), total addressable market (TAM), and market penetration of global digital signage.
- Sub-Markets: Type market in global digital signage, hardware market, software market, services market, and application market in the global market.
- Market, by Type: Market for global digital signage, hardware, software, services.
- Market, by application: Commercial, infrastructural, institutional, industrial, and others.
- Market, by geography: North America (sub-segmented into the U.S., Canada, and others), Europe (sub-segmented into the U.K., Germany, France, and others), APAC (sub-segmented into China, Japan, Korea, and others), and RoW (sub-segmented into the Middle East & Africa and others)
- Market- Competitive Landscape: Market share analysis for global digital signage manufacturers and developers
- Market- Patent Landscape Analysis: patent activity, publication activity, and mapping & analysis.
Table of Contents
1 Introduction (Page No. - 16)
1.1 Objectives of the Study
1.2 Market Definition
1.3 Study Scope
1.3.1 Markets Covered
1.3.2 Geographic Scope
1.4 Years Considered for the Study
1.5 Currency
1.6 Limitations
1.7 Stakeholders
2 Research Methodology (Page No. - 21)
2.1 Research Data
2.1.1 Secondary Data
2.1.1.1 Key Data From Secondary Sources
2.1.2 Primary Data
2.1.2.1 Key Data From Primary Sources
2.1.2.2 Key Industry Insights
2.1.2.3 Breakdown of Primary Interviews
2.2 Variables Considered in Factor Analysis
2.2.1 Introduction
2.2.2 Demand-Side Analysis
2.2.2.1 the Growing Demand for Self-Service Systems in Various Applications
2.2.3 Supply-Side Analysis
2.2.3.1 Increasing Innovations in the Digital Signage Market With New Product Launches as Per the Customers Demands
2.3 Market Size Estimation
2.3.1 Bottom-Up Approach
2.3.2 Top-Down Approach
2.4 Market Breakdown and Data Triangulation
2.5 Research Assumptions
2.5.1 Assumptions
3 Executive Summary (Page No. - 33)
4 Premium Insights (Page No. - 37)
4.1 Attractive Market Opportunities in the Market
4.2 Market Major Applications
4.3 Global Market
4.4 The North America Accounted for A Share of Over 30% of the Market, in 2014
4.5 Market, By Display Type
4.6 Market: the Growing Demand in the Software Type
4.7 Market: Life Cycle Analysis, By Geography
5 Market Overview (Page No. - 42)
5.1 Introduction
5.2 Evolution
5.3 Market Segmentation
5.3.1 By Type
5.3.2 By Hardware
5.3.3 By Software
5.3.4 By Application
5.3.5 By Geography
5.4 Market Dynamics
5.4.1 Drivers
5.4.1.1 Growth of Commercial Display Over Consumer Display in Digital Signage
5.4.1.2 Cost-Efficiency and Assured Return on Investment
5.4.1.3 Prevention of Paper Wastage By Using Digital Signage; Use of LED Backlit Panels Leading to Energy Saving
5.4.1.4 OLED-Based Displays Used in Medium Or Small-Screened Devices Such Mobile Phones, Tablets, and Others Would Boost the
Market Growth
5.4.2 Restraints
5.4.2.1 Lack of Standards for Interoperability Between Devices
5.4.2.2 Lack of Awareness About Digital Signage and Its Benefits
5.4.3 Opportunities
5.4.3.1 Increasing Interactivity and Highly Dynamic Nature
5.4.3.2 Emerging Technologies Such as Ultra-High Definition
5.4.3.3 Growing Demand for Signage Solutions for Retail, Hospitality, and Government Organizations
5.4.4 Challenges
5.4.4.1 Protection of Digital Signage From Power Issues
6 Industry Trends (Page No. - 54)
6.1 Introduction
6.2 Value Chain Analysis
6.3 Strategic Benchmarking
6.3.1 Technology Integration and Product Enhancement
7 Digital Signage Market, By Type (Page No. - 57)
7.1 Introduction
7.2 Hardware
7.2.1 Display
7.2.1.1 Display, By Type
7.2.1.1.1 LCD Display
7.2.1.1.2 LED Display
7.2.1.1.3 OLED Display
7.2.1.1.4 Others
7.2.1.2 Display, By Panel Size
7.2.1.2.1 Below 19 Inches
7.2.1.2.2 19 to 32 Inches
7.2.1.2.3 32 to 52 Inches
7.2.1.2.4 52 to 105 Inches
7.2.1.3 Display, By Brightness
7.2.1.3.1 0500 Nits
7.2.1.3.2 5001000 Nits
7.2.1.3.3 1000 Nits and Above
7.2.2 Media Players
7.2.3 Projectors
7.2.4 Mounts and Other Accessories
7.3 Software
7.3.1 Introduction
7.3.2 Edge Server Software
7.3.3 Distribution and Scheduling Software
7.3.4 Content Management Software
7.3.5 Others (Analytics)
7.4 Services
7.4.1 Installation Services
7.4.2 Maintenance and Support Services
7.4.3 Others
8 Digital Signage Market, By Application (Page No. - 85)
8.1 Introduction
8.2 Commercial
8.2.1 Retail
8.2.2 Corporate
8.2.3 Healthcare
8.2.4 Hospitality
8.2.5 Government
8.3 Infrastructural
8.3.1 Transportation
8.3.2 Entertainment
8.4 Institutional
8.4.1 Banking
8.4.2 Education
8.5 Industrial
8.6 Others
9 Geographic Analysis (Page No. - 114)
9.1 Introduction
9.2 North America
9.2.1 The U.S.
9.2.2 Canada
9.2.3 Rest of North America
9.3 Europe
9.3.1 The U.K.
9.3.2 Germany
9.3.3 France
9.3.4 Others
9.4 Asia-Pacific (APAC)
9.4.1 China
9.4.2 Japan
9.4.3 South Korea
9.4.4 Others
9.5 Rest of the World (RoW)
9.5.1 Middle East & Africa
9.5.2 Others
10 Competitive Landscape (Page No. - 131)
10.1 Overview
10.2 Market Share Analysis, Market
10.3 Competitive Situation and Trends
10.3.1 New Product Launches
10.3.2 Agreements, Partnerships, Collaborations,Contracts, & Joint Ventures
10.3.3 Expansions
10.3.4 Acquisitions
11 Company Profiles (Page No. - 138)
(Overview, Products and Services, Financials, Strategy & Development)*
11.1 Introduction
11.2 Adflow Networks
11.3 AU Optronics Corp.
11.4 LG Display Co., Ltd.
11.5 NEC Display Solutions
11.6 Omnivex Corporation
11.7 Panasonic Corporation
11.8 Planar Systems, Inc.
11.9 Samsung Electronics Co., Ltd.
11.10 Sharp Corporation
11.11 Sony Corporation
*Details on Overview, Products and Services, Financials, Strategy & Development Might Not Be Captured in Case of Unlisted Companies.
12 Appendix (Page No. - 164)
12.1 Insights of Industry Experts
12.2 Discussion Guide
12.3 Introducing RT: Real Time Market Intelligence
12.4 Available Customizations
12.5 Related Reports
List of Tables (87 Tables)
Table 1 Major Product Launches (20142015)
Table 2 Drivers of Digital Signage Market
Table 3 Restraints of Market
Table 4 Opportunities of Digital Signage Market
Table 5 Challenge of Digital Signage Market
Table 6 Market Size, By Type, 20142020 (Billion USD)
Table 7 Hardware: Market Size, By Type, 20142020 (Billion USD)
Table 8 Hardware : Market Size, By Type,20142020 (Million Units)
Table 9 Hardware : Market Size, By Application,20142020 (Billion USD)
Table 10 Display: Digital Signage Market Size, By Display Type,20142020 (Billion USD)
Table 11 Display : Market Size, By Display Type,20142020 (Million Units)
Table 12 Display : Market Size, By Application,20142020 (Billion USD)
Table 13 Display: Market Size, By Panel Size,20142020 (Billion USD)
Table 14 Display: Market Size, By Panel Size,20142020 (Million Units)
Table 15 Display: Market Size, By Brightness,20142020 (Billion USD)
Table 16 Display : Market Size, By Brightness,20142020 (Million Units)
Table 17 Media Player: Digital Signage Market, By Application (Billion USD)
Table 18 Projector: Market Size, By Application,20142020 (Billion USD)
Table 19 Mounts and Other Accessories: Market Size, By Application (Billion USD)
Table 20 Software: Digital Signage Market Size, By Software Type,20142020 (Billion USD)
Table 21 Software: Market Size, By Application,20142020 (Billion USD)
Table 22 Edge Server Software: Market Size, By Application,20142020 (Billion USD)
Table 23 Distribution and Scheduling Software: Market, By Application, 20142020 (Billion USD)
Table 24 Content Management Software: Market Size, By Application, 20142020 (Billion USD)
Table 25 Others (Analytics): Market Size, By Application,20142020 (Billion USD)
Table 26 Services: Digital Signage Market Size, By Service Type,20142020 (Billion USD)
Table 27 Services: Market Size, By Application,20142020 (Billion USD)
Table 28 Market, By Application, 20142020 (Billion USD)
Table 29 Market, By Commercial Applications,20142020 (Billion USD)
Table 30 Hardware: Digital Signage Market, By Commercial Application,20142020 (Billion USD)
Table 31 Installation Services : Digital Signage Market, By Commercial Application (Billion USD)
Table 32 Display: Digital Signage Market, By Commercial Application,20142020 (Billion USD)
Table 33 Software: Market, By Commercial Application,20142020 (Billion USD)
Table 34 Services: Digital Signage Market By Commercial Application,20142020 (Billion USD)
Table 35 Maintenance & Support Services: Market, By Commercial Application, 20142020 (Billion USD)
Table 36 Media Player: Market, By Commercial Application,20142020 (Billion USD)
Table 37 Other Services: Digital Signage Market, By Commercial Application,20142020 (Billion USD)
Table 38 Edge Server Software: Market, By Commercial Application, 20142020 (Billion USD)
Table 39 Projector: Digital Signage Market, By Commercial Application,20142020 (Billion USD)
Table 40 Distribution and Scheduling Software: Market, By Commercial Application, 20142020 (Billion USD)
Table 41 Mounts & Other Accessories: Market By Commercial Application, 20142020 (Billion USD)
Table 42 Content Management System Software: Digital Signage Market, By Commercial Application, 20142020 (Billion USD)
Table 43 Other Software: Market, By Commercial Application,20142020 (Billion USD)
Table 44 Market, By Infrastructural Application,20142020 (Billion USD)
Table 45 Hardware: Market, By Infrastructural Application,20142020 (Billion USD)
Table 46 Software: Market Size, By Infrastructural Application, 20142020 (Billion USD)
Table 47 Digital Signage Services Market, By Infrastructural Application,(Billion USD)
Table 48 Edge Server Software: Market Size, By Infrastructural Application, 20142020 (Billion USD)
Table 49 Display: Market, By Infrastructural Application,20142020 (Billion USD)
Table 50 Distribution and Scheduling Software: Digital Signage Market, By Infrastructural Application, 20142020 (Billion USD)
Table 51 Content Management System Software : Market, By Infrastructural Application, 20142020 (Billion USD)
Table 52 Installation Services: Market, By Infrastructural Application, 20142020 (Billion USD)
Table 53 Maintenance & Support Services: Market, By Infrastructural Application, 20142020 (Billion USD)
Table 54 Other Services: Market, By Infrastructural Application, 20142020 (Billion USD)
Table 55 Media Players: Market, By Infrastructural Application, 20142020 (Billion USD)
Table 56 Projector: Market, By Infrastructural Application,20142020 (Billion USD)
Table 57 Mount & Other Accessories: Digital Signage Market, By Infrastructural Application, 20142020 (Billion USD)
Table 58 Others Software: Digital Signage Market, By Infrastructural Application, 20142020 (Billion USD)
Table 59 Digital Signage Market, By Institutional Application,20142020 (Billion USD)
Table 60 Hardware: Market, By Institutional Application,20142020 (Billion USD)
Table 61 Software: Market, By Institutional Application,20142020 (Billion USD)
Table 62 Digital Signage Services Market, By Institutional Application,20142020 (Billion USD)
Table 63 Digital Signage Installation Services Market, By Institutional Application, 20142020 (Billion USD)
Table 64 Display: Market, By Institutional Application,20142020 (Billion USD)
Table 65 Media Player: Market, By Institutional Application,20142020 (Billion USD)
Table 66 Edge Server Software: Market, By Institutional Application, 20142020 (Billion USD)
Table 67 Distribution and Scheduling Software: Digital Signage Market, By Institutional Application, 20142020 (Billion USD)
Table 68 Maintenance & Support Services: Market, By Institutional Application, 20142020 (Billion USD)
Table 69 Projector : Market, By Institutional Application,20142020 (Billion USD)
Table 70 Mount & Other Accessories: Digital Signage Market, By Institutional Application, 20142020 (Billion USD)
Table 71 Content Management System Software: Market, By Institutional Application, 20142020 (Billion USD)
Table 72 Other Software: Market, By Institutional Application, 20142020 (Billion USD)
Table 73 Other Services: Market, By Institutional Application,20142020 (Billion USD)
Table 74 Market Size, By Region, 20142020 (Billion USD)
Table 75 Commercial: Digital Signage Market, By Region, 20142020 (Billion USD)
Table 76 North America: Market Size, By Country,20142020 (USD Billion)
Table 77 Infrastructural: Digital Signage Market Size, By Region,20142020 (Billion USD)
Table 78 Europe: Market Size, By Country,20142020 (Billion USD)
Table 79 Institutional: Digital Signage Market Size, By Region,20142020 (Billion USD)
Table 80 APAC: Market Size, By Country, 20142020 (Billion USD)
Table 81 Industrial: Digital Signage Market Size, By Region,20142020 (Billion USD)
Table 82 RoW: Market Size, By Country, 20142020 (Billion USD)
Table 83 Others: Market Size, By Region, 20142020 (Billion USD)
Table 84 New Product Launches, 20122015
Table 85 Agreements, Partnerships, Collaborations, & Joint Ventures,20122015
Table 86 Expansions, 20122015
Table 87 Acquisitions, 20112015
List of Figures (85 Figures)
Figure 1 Markets Covered
Figure 2 Market, By Application
Figure 3 Research Design
Figure 4 Increasing Importance of Self-Service Systems in Digital Signage Applications
Figure 5 Increasing Number of New Product Launches in the Market (20122015)
Figure 6 Bottom-Up Approach
Figure 7 Top-Down Approach
Figure 8 Assumptions of the Research Study
Figure 9 The Digital Signage Hardware Market is Estimated to account for More Than 45% Share of the Overall Digital Signage Market in 2015
Figure 10 Market Size, By Application 20152020
Figure 11 Digital Signage Geographical Market Share, 2015
Figure 12 Digital Signage Market, By Application (2015 vs. 2020 )
Figure 13 High Brightness Displays are Expected to Grow at the Highest CAGR From 2015 to 2020
Figure 20 APAC is Expected to Grow at Highest Growth Rate During the Forecast Period
Figure 21 Digital Signage Cuts Costs and Provides Returns on Investment
Figure 22 Evolution of Digital Signage
Figure 23 Market Segmentation ,By Type
Figure 24 Digital Signage Hardware Market Segmentation
Figure 25 Market Segmentation, By Software
Figure 26 Market Segmentation, By Application
Figure 27 Market Segmentation, By Geography
Figure 28 Market: Drivers, Restraints, Opportunities and Challenges
Figure 29 Value Chain Analysis: Major Value is Added During the Development and Integration Phase of the Digital Signage System
Figure 30 LG Display Co. Ltd Stood as A Key Player in the Digital Signage Market With New Product Launches and Investments
Figure 31 Market, By Type
Figure 32 Software Market is Likely to Have A High Growth in the Digital Signage Market Between 2015 and 2020
Figure 33 Market, By Hardware
Figure 34 Displays are Expected to Account for More Than 65% Share of the Digital Signage Hardware Market, 2015
Figure 35 LED is A Growing Technology and is Expected to Be Used Widely, By 2020
Figure 36 The LED Technology is Expected to Be the Dominant Technology By 2020
Figure 37 Usage of Displays Based on Various Screen Sizes
Figure 38 The Displays of 32 to 52 are Highly Used and are the Highest-Growing Among All the Different Sizes in the Market, 2015
Figure 39 High Brightness Displays Expected to Have A High Growth Rate Between 2015 and 2020, Especially in Outdoor Applications
Figure 40 Types of Software Market
Figure 41 Distribution and Scheduling Software is Expected to Grow at A Higher CAGR Between 2015 and 2020
Figure 42 Edge Server Software
Figure 43 Processing of Edge Server
Figure 44 Processes Involved in Distribution and Scheduling Software
Figure 45 Content Management Software - Functions
Figure 46 Installation Services are Growing at the Highest Rate Among the Various Digital Services in the Market, 2015
Figure 47 Factors to Be Considered for the Proper Installation of Displays
Figure 48 Market Application Market Scope
Figure 49 The Retail Application is Expected to Dominate the Hardware Market By 2020
Figure 50 Hospitality Application is Expected to Grow at A High Rate in the Display Market By 2020
Figure 51 Usage of Digital Signage in Retail Application
Figure 52 Retail Segment is Expected to Dominate the Commercial Application of Media Player Market, By 2020
Figure 53 Benefits of Digital Signage in the Government Sector
Figure 54 Healthcare to Hold the Major Market Share Till 2020
Figure 55 Transportation is Expected to Grow at the Highest Rate in the Software Market (20152020)
Figure 56 The Entertainment Application is Expected to Grow at A High Rate in the Installation Services Between 2015 and 2020
Figure 57 Banking is Expected to Grow Fast in Institutional Market Between 2015 and 2020
Figure 58 Market, By Geography
Figure 59 Market Snapshot (Between 2015 and 2020)
Figure 60 Asia-Pacific is Expected to Be the Fastest-Growing Region, 20152020
Figure 61 U.S. is Expected to Hold the Major Share of the Market
Figure 62 The U.K. Accounted for ~38% to the European Digital Signage Market, 2015
Figure 63 Germany is Expected to Grow at the Highest CAGR Till 2020
Figure 64 APAC Region is Estimated to Grow at the Highest Rate in the Market
Figure 65 China to Hold the Largest Share of APAC Digital Signage Market till 2020
Figure 66 Middle East and Africa Region to Grow at A Higher Rate Than Others in RoW 20152020
Figure 67 Companies Adopted New Product Launches and Expansions as the Key Growth Strategies, (2013 - 2015)
Figure 68 Sony Corporation Grew at A Higher Rate Between 2012 and 2014
Figure 69 Digital Signage: Market Share Analysis, By Key Player, 2014
Figure 70 Market Evaluation Framework: New Product Development has Fueled Growth and Innovation
Figure 71 Battle for Market Share: New Product Launches and Partnerships, Were the Key Strategies Adopted By Companies Between 2012 and 2015
Figure 72 Geographic Revenue Mix of the Top 5 Market Players, 2014
Figure 73 Competitive Benchmarking of the Key Market Players: Samsung Electronics has Emerged as A Dark Horse in Terms of CAGR For20122014
Figure 74 AU Optronics Corp.: Company Snapshot
Figure 75 AU Optronics Corporation: SWOT Analysis
Figure 76 LG Display Co., Ltd.: Company Snapshot
Figure 77 LG Display Co., Ltd.: SWOT Analysis
Figure 78 Panasonic Corporation: Company Snapshot
Figure 79 Panasonic Corporation: SWOT Analysis
Figure 80 Planar Systems, Inc: Company Snapshot
Figure 81 Planar Systems, Inc.: SWOT Analysis
Figure 82 Samsung Electronics Co. Ltd.: Company Snapshot
Figure 83 Sharp Corporation: Company Snapshot
Figure 84 Sharp Corporation: SWOT Analysis
Figure 85 Sony Corporation : Company Snapshot
The digital signage market has been gaining momentum over the last few years. This is mainly attributed to the rise in the demand for self-service systems and the increasing adoption of digital signage over other advertising media. Potential growth opportunities are also expected for the newly emerging telecom providers and manufacturing sectors in the market. However, the lack of standards for interoperability between devices and the lack of awareness of the benefits of digital signage among the end users confine the growth of the market. The digital signage providers also need to work on adopting innovative approaches to acquire new customers and retain the existing ones.
There is a growing demand for high brightness displays in various sectors, especially retail and hospitality, as it helps them to attract the targeted customers. APAC is expected to grow at the highest CAGR of 9.34% between 2015 and 2020, mainly owing to the presence of a large number of companies in the digital signage supply chain in this region such as AU Optronics (Taiwan), LG Display Co., Ltd. (South Korea), Panasonic Corp. (Japan), Samsung Electronics Co., Ltd. (South Korea), Sharp Corporation (Japan), and others who provide innovative solutions to address the demands of the end users for the digital signage application. There are also tremendous growth opportunities for the overall digital signage market in South Korea, China, and Canada.
This report provides the current size of the digital signage market and provides the forecast of the same for different regions, namely North America, Europe, AsiaPacific, and the rest of the world. It also analyzes the winning imperatives and trends in the global market. In addition, the report profiles over 10 companies from all the regions of the globe along with their recent activities such as mergers & acquisitions, collaborations, joint ventures, and new product developments. The global market was valued at $14.63 Billion in 2014 and is expected to reach $23.76 Billion by 2020, at a CAGR of 8.18% between 2015 and 2020.
This report describes the market trends and challenges of the global digital signage market and forecasts the market till 2020, on the basis of type, application, and geography. The report also features the detailed competitive landscape with identification of the key players with along with their in-depth market share analysis in the global market. The sections and sub-segments in the report also analyze the drivers, restraints, and opportunities in the market, and the current market trends that would revolutionize the global market.
The major players in global digital signage market are NEC Display Solutions (Japan), Samsung Electronics Co. Ltd (South Korea), LG Display Co., Ltd. (South Korea), Sharp Corporation (Japan), Sony Corporation (Japan), Panasonic Corporation (Japan), AU Optronics Corp. (Taiwan.), Planar Systems, Inc. (U.S.), Adflow Networks (Canada), and Omnivex Corporation (Canada).
Global Digital Signage Market (20132020)
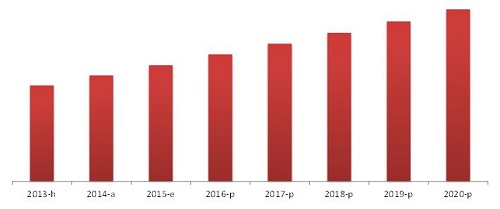
Note: H= Historical year A=Actual year, E=Estimated year, and P=Projected year
Source: Markets and Markets Analysis
The global digital signage market is expected to grow at a CAGR of 8.18% between 2015 and 2020. In the global market, the commercial application is the major application, followed by the infrastructural application. In terms of region, APAC is the market leader, followed by Europe.
We will customize the research for you, in case the report listed above does not
meet with your exact requirements. Our custom research will comprehensively cover
the business information you require to help you arrive at strategic and profitable
business decisions.
Please visit http://www.marketsandmarkets.com/knowledge-process-outsourcing-services.asp to specify your custom Research Requirement

